
Orchestrate Shopfloor Operations and Power them With Unified Intelligence
Unite Connected Worker and MES capabilities to build the execution platform that coordinates, governs, and continuously improves operational work on the shop floor, across humans, AI agents, and robotic systems


Manufacturing Software: Smart and Connected
Transform your manufacturing operations with Azumuta! Our platform empowers operators to become key players in decision-making and innovation, equipping your entire process for the digital age.
Azumuta is a strategic partner, offering digital solutions to face the rising regulatory demands, skill shortages, and complex product challenges. We enable seamless collaboration between operators and managers, giving you full control over the production with cutting-edge technology.

Power your Factory with AI
Azumuta Intelligence refers to the suite of artificial intelligence features that Azumuta provides for the manufacturing industry. With its unique approach, Azumuta automates tasks and optimizes a wide range of operations across the shop floor. This innovative approach significantly enhances operational efficiency, quality, and employee training in factories worldwide.
Everything You Need On The Shop Floor
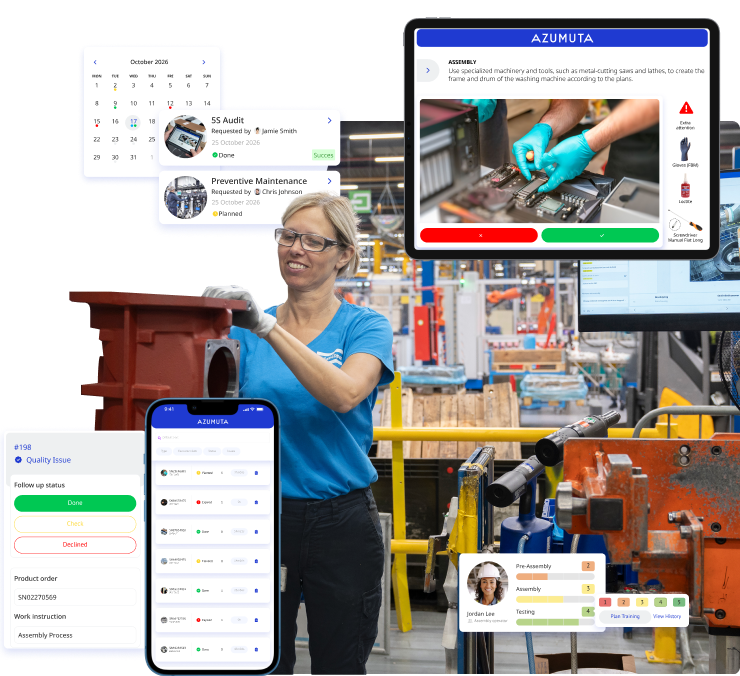
Digitize your shop floor activities through a central platform, rooted in advanced technology and a profound expertise of the industry. Transfer essential information directly to the shop floor and capture data in real time.
Digital Work Instructions
Digitize your work instructions and give your operators always up-to-date, accessible, and interactive work instructions that include videos, images, 3D files, and more. Empower your operators to create tickets to flag issues detected, gather shop floor data, and in-line quality controls. Azumuta is used for quick onboarding, retraining, and on-the-job training and can be connected with your ERP system to have your product orders always in sync with the right work instruction.
Learn more →
Quality Assurance
Our quality assurance module optimizes quality compliance by tracking the entire production process and visualizing real-time quality issues. It also handles audits, checklists, issue ticketing, and generates comprehensive management reports.
Learn more →
Skill-Matrix & Training
Foster frontline workforce development using our Skill Matrix and Training module. Track training progress and competencies, identify growth opportunities and strengths, and organize clear learning paths for your team's development.
Learn more →
Audits & Digital Checklists
Easily manage all visual work instructions, training documents, and technical resources in one centralized platform. This ensures streamlined creation and standardization for operational efficiency.
Learn more →
Facing These Challenges? We've Got You!
Talent Shortage
Reactive Quality Assurance
Increasing Compliance Regulations
Difficult Access to Work Instructions
Tribal Knowledge
Automation Integration
Don't just take our word for it!

"Azumuta is more than just an information tool; it's also part of our learning and development path. This way, we can flexibly select people with the right attitude, and offer them the ideal training environment to develop themselves."


The ability to adapt quickly to changes in work instructions has given us a competitive advantage, while the fully automated distribution of work instructions has decreased complexity and reduced errors on the shop floor. Azumuta has revolutionized our work instruction management process and made our operations more agile.

Previously, as an organization, we relied heavily on the discipline of the operators to fill in the necessary production reports. With Azumuta, we can send the necessary reminders to the operators if necessary. Moreover, we can monitor in real time whether they have actually filled in the production reports at the scheduled time.
Here's How Azumuta Is Impacting The Industry
Transform your shop floor operations with our solutions: witness a significant quality leap, enhanced productivity, and a seamless shift to paperless operations.
Why Azumuta →Quality Increase
Productivity Increase
Less Papers
Built For Industries That Prioritize Operational Efficiency
Connect Azumuta With Other Tools
 Microsoft Teams
 Featured Blog Posts
View all posts →
Join The Digital Shop Floor Revolution!
