Another advantage of using andon in Azumuta is that you can have a helicopter view of your plant’s production status. By using our dashboards functionality, you can see whether there are any active andon call – and on from specific part of the plant was it called from. That way, you can take the necessary corrective actions as quickly and precisely as possible.
In this guide webpage, we will show you how to display andon in a dashboard. In general, this entire process takes 5 phases:
- Phase 1: Creating the Structure
- Phase 2: Creating the Dashboard
- Phase 3: Configuring the Dashboard
- Phase 4: Creating Product Orders
- Phase 5: Displaying Andon on a Widget
We will provide a detailed explanation of each phase in the guide sections below
Phase 1: Creating the Structure #
Before you can display andon on a dashboard, you will need to first create the ideal andon system structure in your workspace. Get started with Andon.
Phase 2: Creating the Dashboard #
After you’ve created the structure in phase 1, the next phase is to create a dashboard. Click here to see how to create a dashboard.
Phase 3: Making the Dashboard Automatically Refresh #
After the dashboard has been created, you will need to configure it so that the dashboard automatically refreshes. To do it, please follow the steps below:
- Navigate to the dashboard that you’ve created on phase 2.
- Click on the three-dot icon next to the dashboard’s name.
- Click on “Edit dashboard”.
- Under the “Auto refresh interval in seconds” field, fill in the interval time (in seconds) between each automatic refresh. The interval time should be at least 5 seconds long.
- When you’re done, click on “Save”.
Phase 4: Creating a Product Order and Assigning a Work Instruction from That Product Order to a Zone #
Afterward, you will need to create a product order. Click here to learn more about product orders, and the possible methods to create them.
A product order contains one or several work instructions. After a product order has been made, you will need to assign one or several work instructions from that product order to the zone(s) that you’ve made in phase 1. Only assign the work instruction(s) that you would like to be displayed on the dashboard.
Here’s how to assign a work instruction to a zone:
- Navigate to the product order that contains the work instruction that you would like to assign to a zone.
- Click on the three-dot icon next to the work instruction that you would like to assign to a zone.
- Click on “Assign to zones”.
- Select the zone(s) that you would like to assign this work instruction to. You can assign a work instruction to one or multiple zones.
Note: We recommend that all instruction steps within the work instruction have a time study. That way, your widgets will show punctuality & productivity related data. You can read more about it on phase 5.
Phase 5: Displaying Andon on a Dashboard Widget #
The fifth phase involves displaying andon on a widget.
In the guide sections below, we will explain how to create & use the control board (individual zones) widget for displaying Andon.
The Control Board (Individual Zones) Widget #
If you’re not already familiar with this widget, you can find detailed information on the control board (individual zones) widget in this guide.
Creating the Widget #
- Go to the dashboard that you’ve made in phase 2.
- Click on the yellow plus button on the bottom right of the screen.
- Navigate to “Control board (individual zones)” under the “Product Orders” widget category, and click on “Create”.
- Select the zone(s) that you would like to display in this widget. The zones here should refer to the structure that you’ve made in phase 1.
- For the “Default tolerance percentage” field, enter the time tolerance (as a percentage) for the given time study. For example, if the time study is 60 seconds and the tolerance percentage is set to 10%, that means that the time tolerance is 6 seconds. This means that the total allowed time in this widget for that particular work instruction is 66 seconds (60 seconds + 6 seconds). The widget’s bar will stay green for 66 seconds and turn orange as a warning once this time tolerance has been exceeded.
- For the “Board” field, select the andon board that will be linked to this widget.
- For the “Highlight zone in red for these columns” field, we recommend that you select only the first column that appears in this option. That way, whenever an andon issue is reported, the zone where the andon is reported from will be highlighted in red. That way, you can immediately tell from which zone is the andon called. Meanwhile, the second column only concenns andon issues that are deemed as solved. Check out the “Using the Widget” guide section to see how it works.
- For the “Play sound for these columns” field, select which andon column(s) will trigger a specific sound – whenever an andon issue reaches this andon column. We recommend you to select only the first column that appears in this option, so that you’ll be notified only when a new andon issue is reported .The second column only concenns andon issues that are deemed as solved.
- For the “Tag of audio attachment of each zone” field, select the audio file tag that will be played on this widget.
- Click on “Add”.
- Drag the widget to make it bigger.
- Select the widget’s timescope.
- Click on “Save”.
- Click on “Yes”.
Using the Widget #
This widget works by showing the following information:
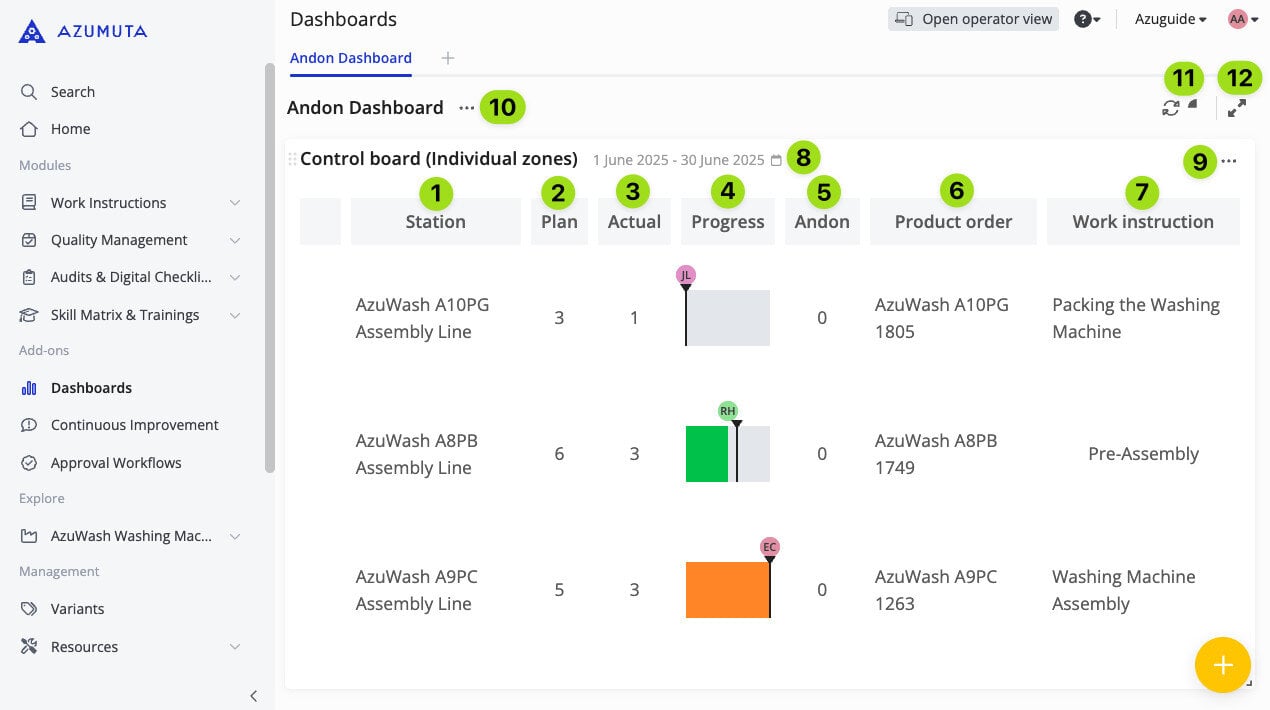
- This column shows the list of workstations (also known as zones) that are displayed on this widget.
- This column shows the number of product orders that have been assigned to each zone.
- This column shows the number of finished product orders in each zone.
- The Progress column shows the live progress of the work instruction on each zone currently being worked on by your operators. The black line on each chart represents the time study for each work instruction. If a work instruction’s progress is behind schedule (and the additional tolerance that you’ve set when creating the widget), then that work instruction’s progress bar will turn orange.
- This column shows the number of times an andon has been called on each zone.
- This column shows the name/number of the product order that is currently being worked on in each zone.
- This column shows the name of the work instruction that is currently being worked on in each zone.
- Click here to change the widget’s timescope.
- Click here to access the widget’s settings.
- Click here to access the dashboard’s settings.
- Click here to manually refresh the dashboard.
- Click here to make the dashboard go full screen.
Moreover, whenever an andon is called, the zone where the andon call originated will be highlighted in red. That way, you can immediately tell where attention is needed and respond promptly to the andon call. Additionally, a sound of your choice (if you added one when creating the widget) will also play.
Have a look at the video below to see how the widget appears when an andon is being called (we choose to use the sound of an alarm for this widget).