
Answers on Number Checks Over Time (Line Chart) for Product Orders
What Is Displayed in This Widget?
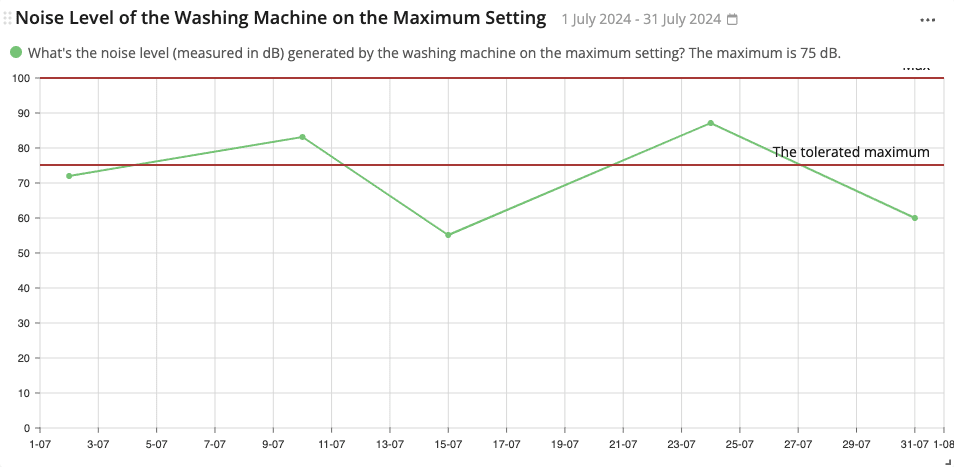
This widget displays data captured from number-based checks (except torque checks) in product orders over time – in the format of a line chart. For example, data about a product’s performance, the time spent on making that product, the defect rate of a certain product type, etc.
These data are displayed side-by-side so that supervisors can analyze the fluctuation of these numerical data over time.
The X-axis represents the time, while the Y-axis represents the answer to these number-based checks.
Note: Before creating a dashboard with this widget, make sure that the product orders have been executed (at leasy partially).
How to Deploy This Widget?
Please follow the steps below to deploy this widget to a new dashboard. However, if you would like to deploy this widget to an existing dashboard, then you can navigate to that dashboard and start from step No.4 instead.
- Click on “Dashboards” on the side panel.
- Click on the plus icon under “Dashboards”.
- Type in the new dashboard name.
- Click on the yellow plus button on the bottom right of the screen.
- Navigate to “Answers on number checks over time (line chart)” under the “Product Orders” widget category, and click on “Create”.
- Select the work instruction associated with the product orders.
- Select the work instruction step(s) that you would like to be displayed on the widget. You can also tick on the box next to the work instruction block or the work instruction name to select work instruction steps in bulk.
- Click on the date range (next to the widget name), and adjust the date range. Make sure that it covers the time period where the product orders were executed. Click on “Custom rolling range” for more date range options.
- When you’re done, click on “Save”.
- Click on “Yes”.
- Adjust the widget’s size as desired.
Configuring the Widget
Check out the widget configuration guides to learn how to configure an Azumuta widget.