Chosen Audit Answers
What Is Displayed in This Widget?
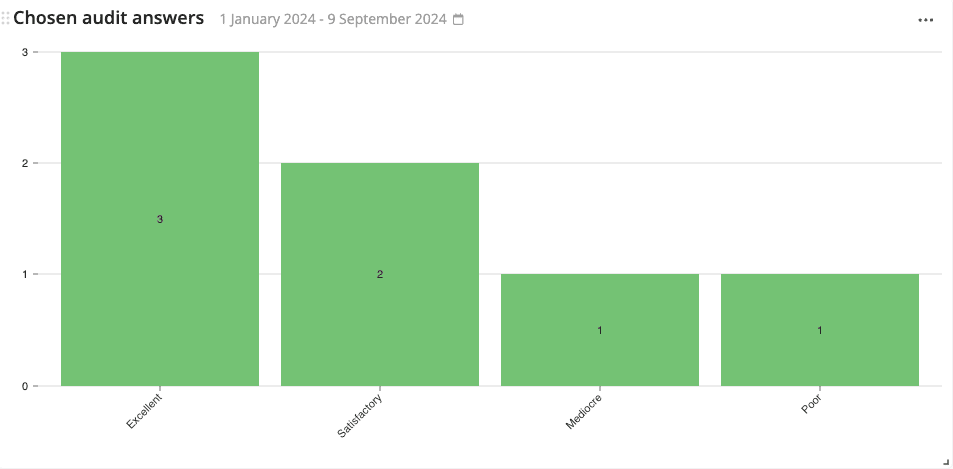
This widget shows the answers (and their frequency) to product checks on audits within a given time period – in the format of a bar chart.
This widget is exceptionally useful if you would like to analyze one specific question/test within an audit deeply and its frequency over time.
For example, the image below shows the frequency of answers to the audit question: “What is the general level of awareness among plant employees regarding fire safety procedures?”
The X-axis represents the answers to the chosen product check type, while the Y-axis represents the quantity of those answers.
Note: Before creating a dashboard with this widget, make sure that the audits have already been executed (at least partially).
How to Deploy This Widget?
Please follow the steps below to deploy this widget to a new dashboard. However, if you would like to deploy this widget to an existing dashboard, then you can navigate to that dashboard and start from step No.4 instead.
- Click on “Dashboards” on the side panel.
- Click on the plus icon under “Dashboards”.
- Type in the new dashboard name.
- Click on the yellow plus button on the bottom right of the screen.
- Navigate to “Chosen audit answers” under the “Audits” widget category, and click on “Create”.
- Select the work instruction associated with the audit.
- Select the instruction step that contains the product check that you would like to display on this widget.
- Click on “Add”.
- Click on the date range (next to the widget name), and adjust the date range. Make sure that it covers the time period where the audits were executed. Click on “Custom rolling range” for more date range options.
- When you’re done, click on “Save”.
- Click on “Yes”.
- Adjust the widget’s size as desired.
Configuring the Widget
Check out how you can configure an Azumuta widget here.
Join The Digital Shop Floor Revolution!


