
Control Board (Grouped Zones)
What Is Displayed in This Widget?
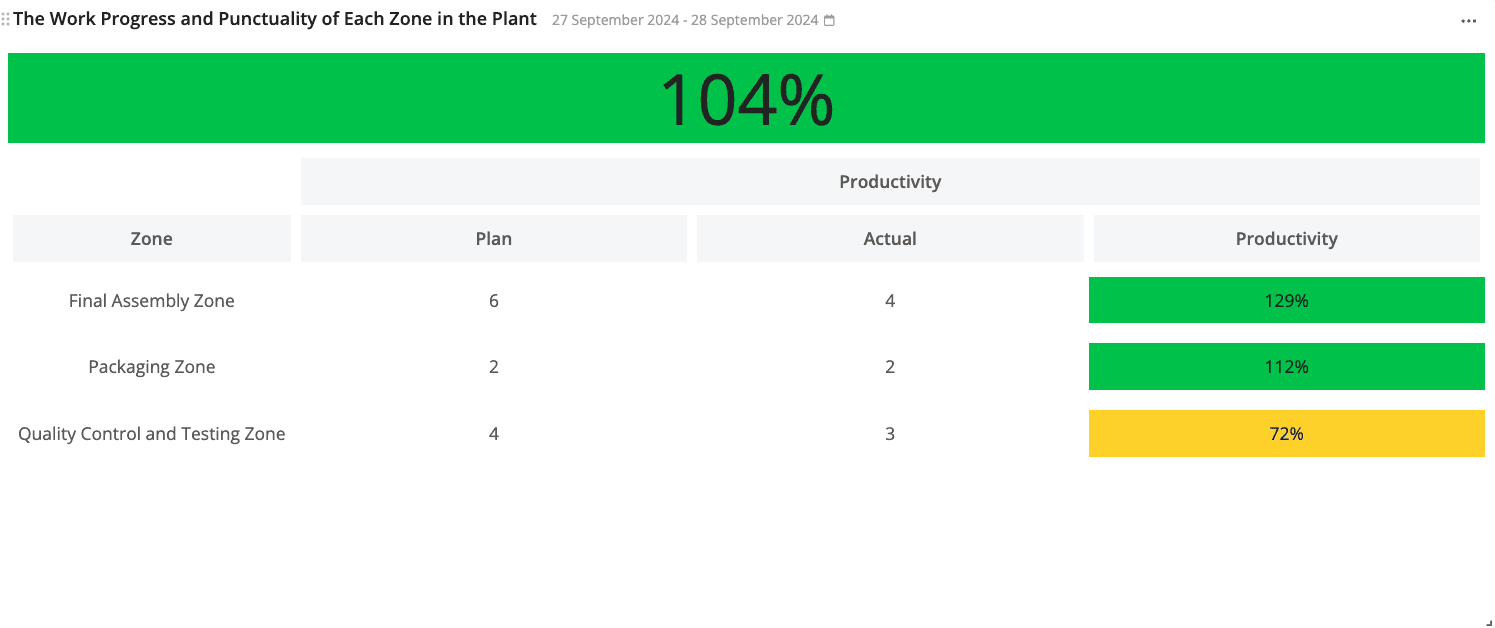
This widget displays the progress of the execution of product orders within selected zones and each zone’s on-time performance – relative to the time study of work instructions that make up product orders within these selected zones.
A zone’s on-time performance is measured by comparing the pace of execution of all work instructions in that zone – in comparison to each work instruction’s pre-determined time study.
If a zone is completely punctual, then its “Productivity” (on-time performance) will be 100%. If a zone’s work pace is faster than its overall time study, then its on-time performance will exceed 100%, and its productivity bar will remain green. However, if a zone’s work pace is slower than its time study, then its on-time performance will go below 100%. If the work pace is also slower than the tolerated limit, then the productivity bar will turn yellow.
That way, as an admin, you can easily monitor the progress of each zone. Thus, whenever any zone is falling behind schedule, you will immediately know which zone is lagging behind and to what extent they are behind schedule. As a result, you can take the necessary actions as soon as possible.
This widget is closely related to the Control Board (Individual Zones) widget. Both widgets focus on the same thing, which is to monitor the progress of production in your plant compared to the production timeline that you’ve set using the time study feature.
However, this widget displays helicopter view data – while the Control Board (Individual Zones) widget shows you granular data.
Note: Make sure that every instruction step in work instructions that are included in each zone displayed on this widget has a time study. Otherwise, this widget won't work as intended.
Here’s an explanation of what’s displayed on this widget:
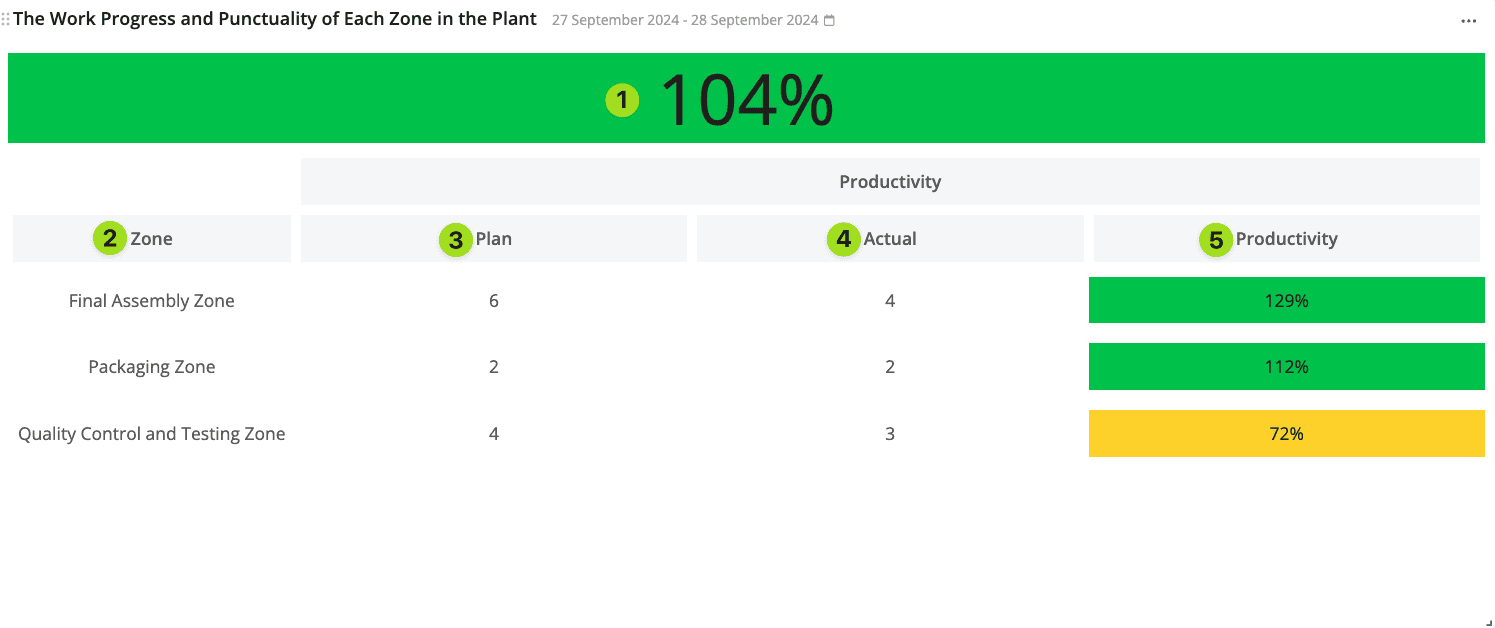
- This number represents the average on-time performance of all zones that are displayed on this widget. We will explain more about how on-time performance is measured on No.5. Moreover, if the on-time performance goes below 100% and the tolerated time limit (we will explain how to adjust the time tolerance in the section below), then the productivity bar will turn yellow.
- The Zone column displays the name of the zones that have been selected for display on this widget.
- The Plan column shows the total number of product orders in each selected zone.
- The Actual column shows the number of product orders that have been finished in each selected zone.
- The Productivity column shows the on-time performance of each zone. Zone on-time performance is measured by comparing the time spent by your operators in completing product orders within that zone to the time study of each work instruction in those product orders. For example, in the image above, operators on the “Final Assembly Zone” were able to finish product orders 29% faster than the time study set by their admin. Therefore, their on-time performance is 129% (100% + 29%). Meanwhile, operators in the “Quality Control and Testing Zone” took 28% longer than the time study set by the admin to finish product orders in that zone. Therefore, their on time performance is 72% (100% – 28 %). Additionally, the time tolerancein this widget is only 5% of the time study. Their deviation (28%) is larger than the time tolerance of 5%. Therefore, their productivity bar is yellow. We created this feature to help you sport underperforming zones quickly and easily.
How to Deploy This Widget?
Before you can deploy this widget, we must first set it up for you. If you’re interested in this widget, please contact us through our support@azumuta.com email.
After the widget has been set up, you can deploy it right away. Please follow the steps below to deploy this widget to a new dashboard. However, if you would like to deploy this widget to an existing dashboard, then you can navigate to that dashboard and start from step No.4 instead.
- Click on “Dashboards” on the side panel.
- Click on the plus icon under “Dashboards”.
- Type in the new dashboard name.
- Click on the yellow plus button on the bottom right of the screen.
- Navigate to “Control board (grouped zones)” under the “Product Orders” widget category, and click on “Create”.
- Select the zone(s) that you would like to display in this widget.
- Under “Default tolerance percentage”, Enter the time tolerance (as a percentage) for the given time study. For example, if the total time study to complete a work instruction is 60 seconds and the tolerance percentage is set to 10%, that means that the time tolerance is 6 seconds. This means that the total allowed time in this widget for that particular work instruction is 66 seconds (60 seconds + 6 seconds). The widget’s bar will stay green for 66 seconds and turn yellow as a warning once this time tolerance has been exceeded.
- Click on “Add”.
- Click on the date range (next to the widget name), and adjust the date range. Make sure that it covers the time period where the product orders were executed. Click on “Custom rolling range” for more date range options.
- When you’re done, click on “Save”.
- Click on “Yes”.
- Adjust the widget’s size as desired.
Configuring the Widget
Check out the widget configuration guides to learn how to configure an Azumuta widget.