Control Chart
What Is Displayed in This Widget?
The Control Chart displays the answers to number-based checks (except torque checks) in work instructions that are linked to product orders – in the format of a line chart.
What’s more, it also displays various important statistical information, which we will explain further as we proceed in this guide webpage.
This widget is a powerful tool for quality controllers. It allows them to monitor any numerical indicator closely, ensuring it stays within the tolerated limits. It helps detect deviations early, enabling timely corrective actions whenever necessary.
The X-axis represents the name of the product orders/the date and time of their execution/both, while the Y-axis represents the selected numerical indicator.
Note: Before creating a dashboard with this widget, make sure that the product orders have been executed (at least partially).
How to Deploy This Widget?
Please follow the steps below to deploy this widget to a new dashboard. However, if you would like to deploy this widget to an existing dashboard, then you can navigate to that dashboard and start from step No.4 instead.
- Click on “Dashboards” on the side panel.
- Click on the plus icon under “Dashboards”.
- Type in the new dashboard name.
- Click on the yellow plus button on the bottom right of the screen.
- Navigate to “Control Chart” under the “Product Orders” widget category, and click on “Create”.
- Select the desired work instruction.
- Select the minimum work instruction version (The oldest acceptable work instruction version). If you update your work instructions regularly, we recommend that you always choose the latest version.
- Select the number of data points (the number of product check data that will be displayed on the widget).
- Select the work instruction step that contains the product check that you would like to be displayed on the widget.
- Click on “Add”.
- Adjust the widget’s size as desired.
Afterward, you can customize this widget by using our wide array of configuration options, which we will explain in the guide section below.
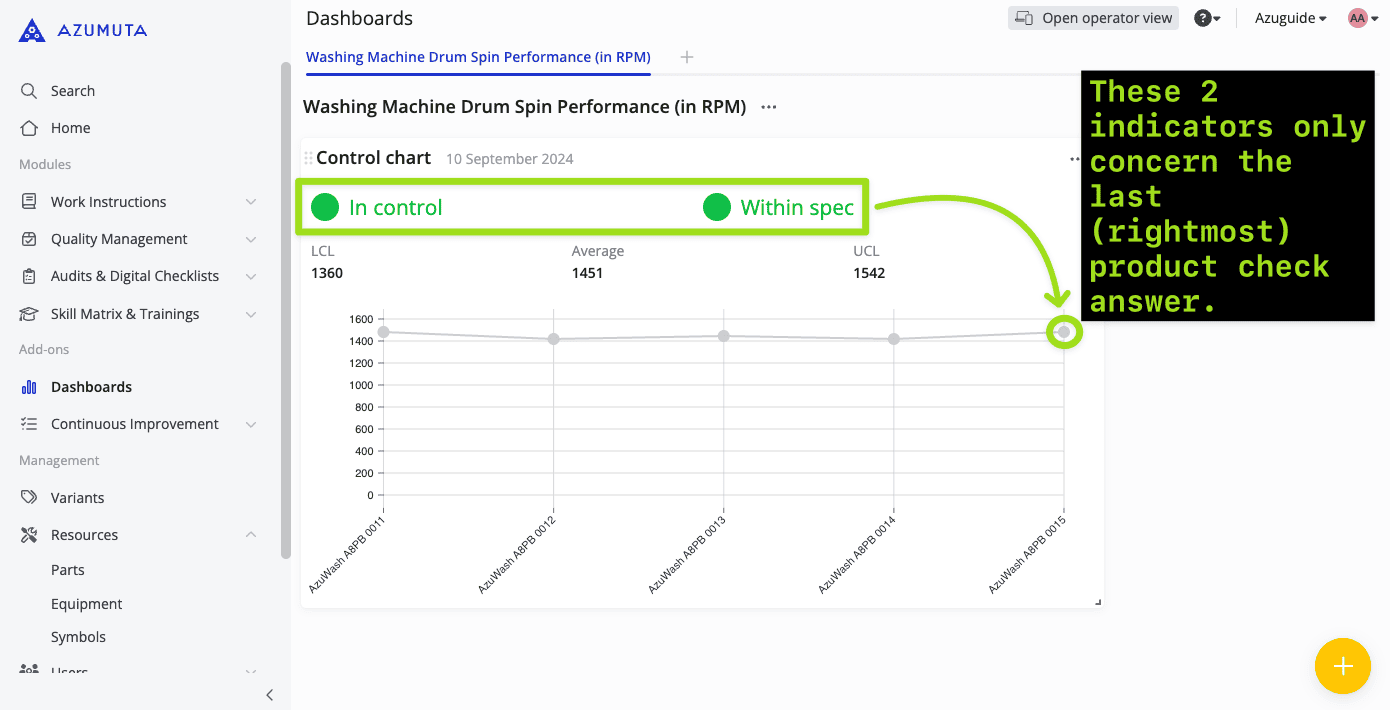
Moreover, it’s important to know that the two indicators shown below only concern the latest product check answer in the widget (the rightmost product check answer). These two indicators are not affected at all by the product check answer that predates the latest product check answer. Please consult the image below for further information:
Configuring the Widget
Check out how you can do the basic Azumuta widget configurations in the widget configuration guides.
Moreover, besides the generic configuration options mentioned in the link above, we will also provide an explanation of the advanced configuration options that are exclusive to this widget:
Note: Unlike other widgets, you can't manually adjust the time period covered by this widget.
Markers
Besides regular markers, this widget can display special markers:
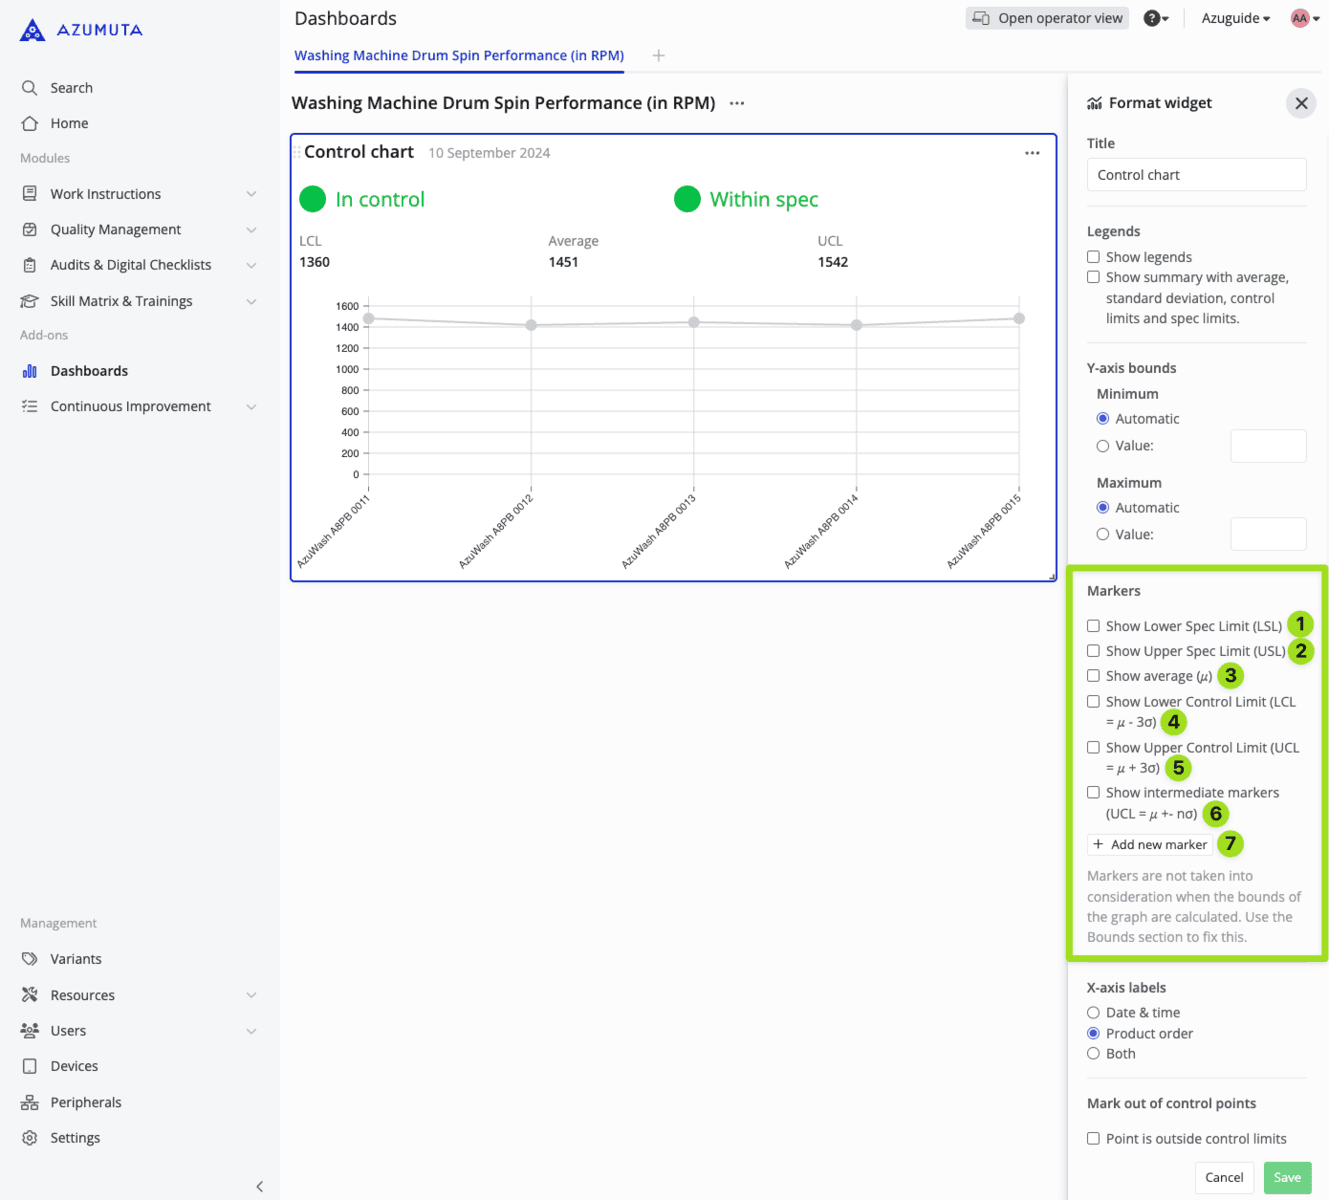
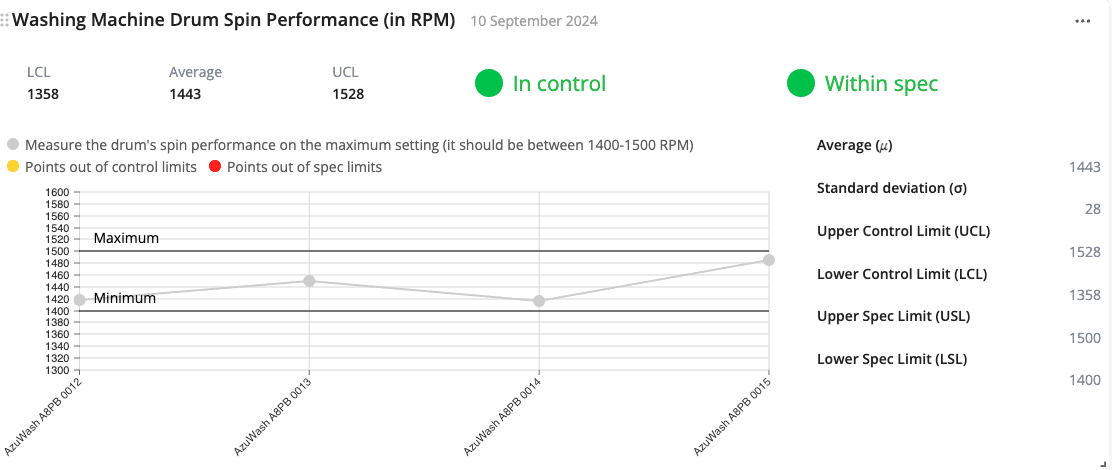
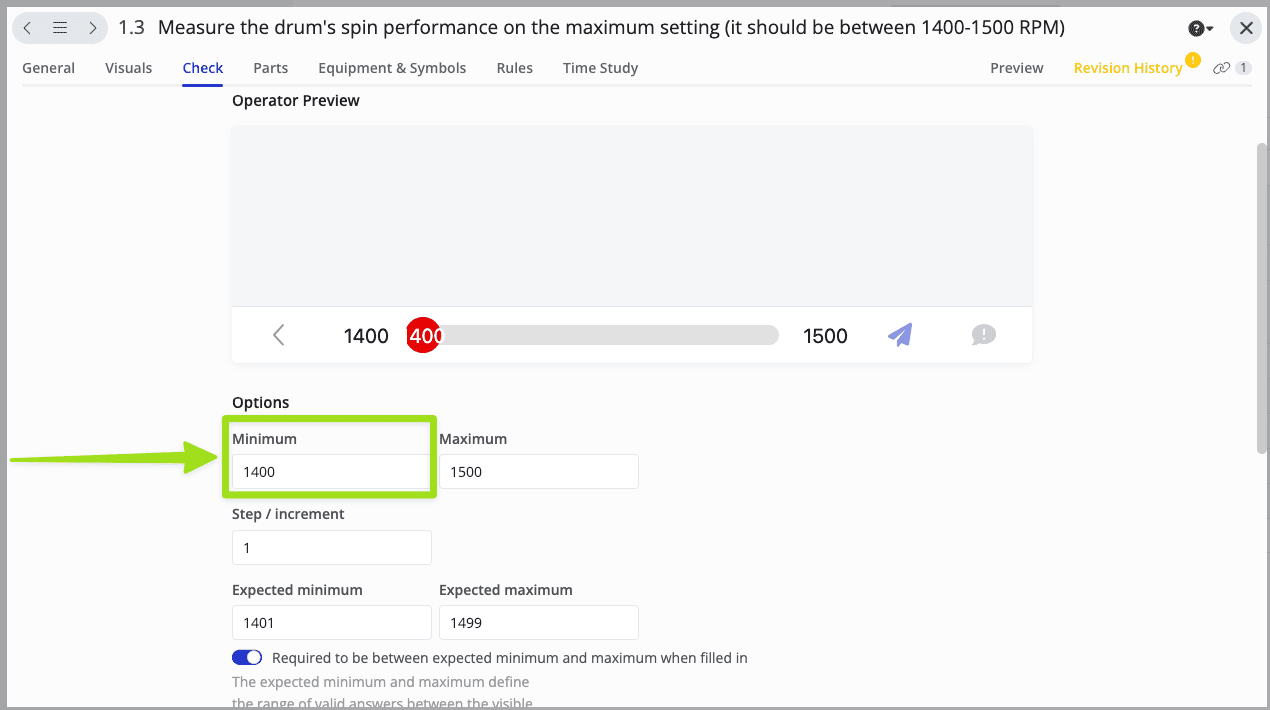
- Tick to display the Lower Spec Limit (LSL) on the widget. LSL is the same as the “Minimum” value on the product check, as shown in the image below:
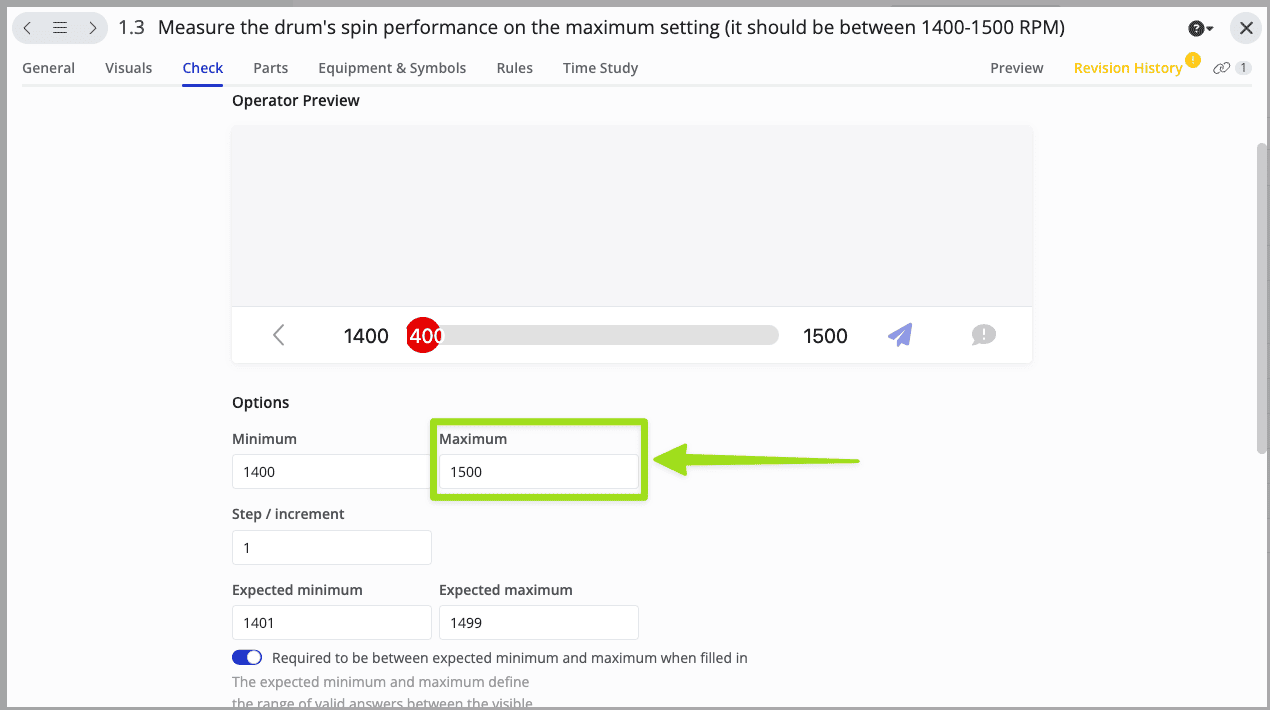
- Tick to display the Upper Spec Limit (USL) on the widget. LSL is the same as the “Maximum” value on the product check, as shown in the image below:
- Tick to display the average value of the product check answers in this widget.
- Tick to display the Lower Control Limit (LCL) on this widget. LCL is a commonly used statistical term in the Six Sigma methodology.
- Tick to display the Upper Control Limit (UCL) on this widget. UCL is a commonly used statistical term in the Six Sigma methodology.
- Tick to display the intermediate markers between LCL and UCL.
- Click to add your own marker. You can add multiple markers.
Note: Besides the Six Sigma methodology-related markers, we can also create pre-formulated markers to suit your shop floor needs. Please contact us through support@azumuta.com to request additional pre-formulated markers.
X-Axis Labels
The X-axis label settings allow you to choose which text to display on the X-axis at the bottom of the widget, as shown in the image below:
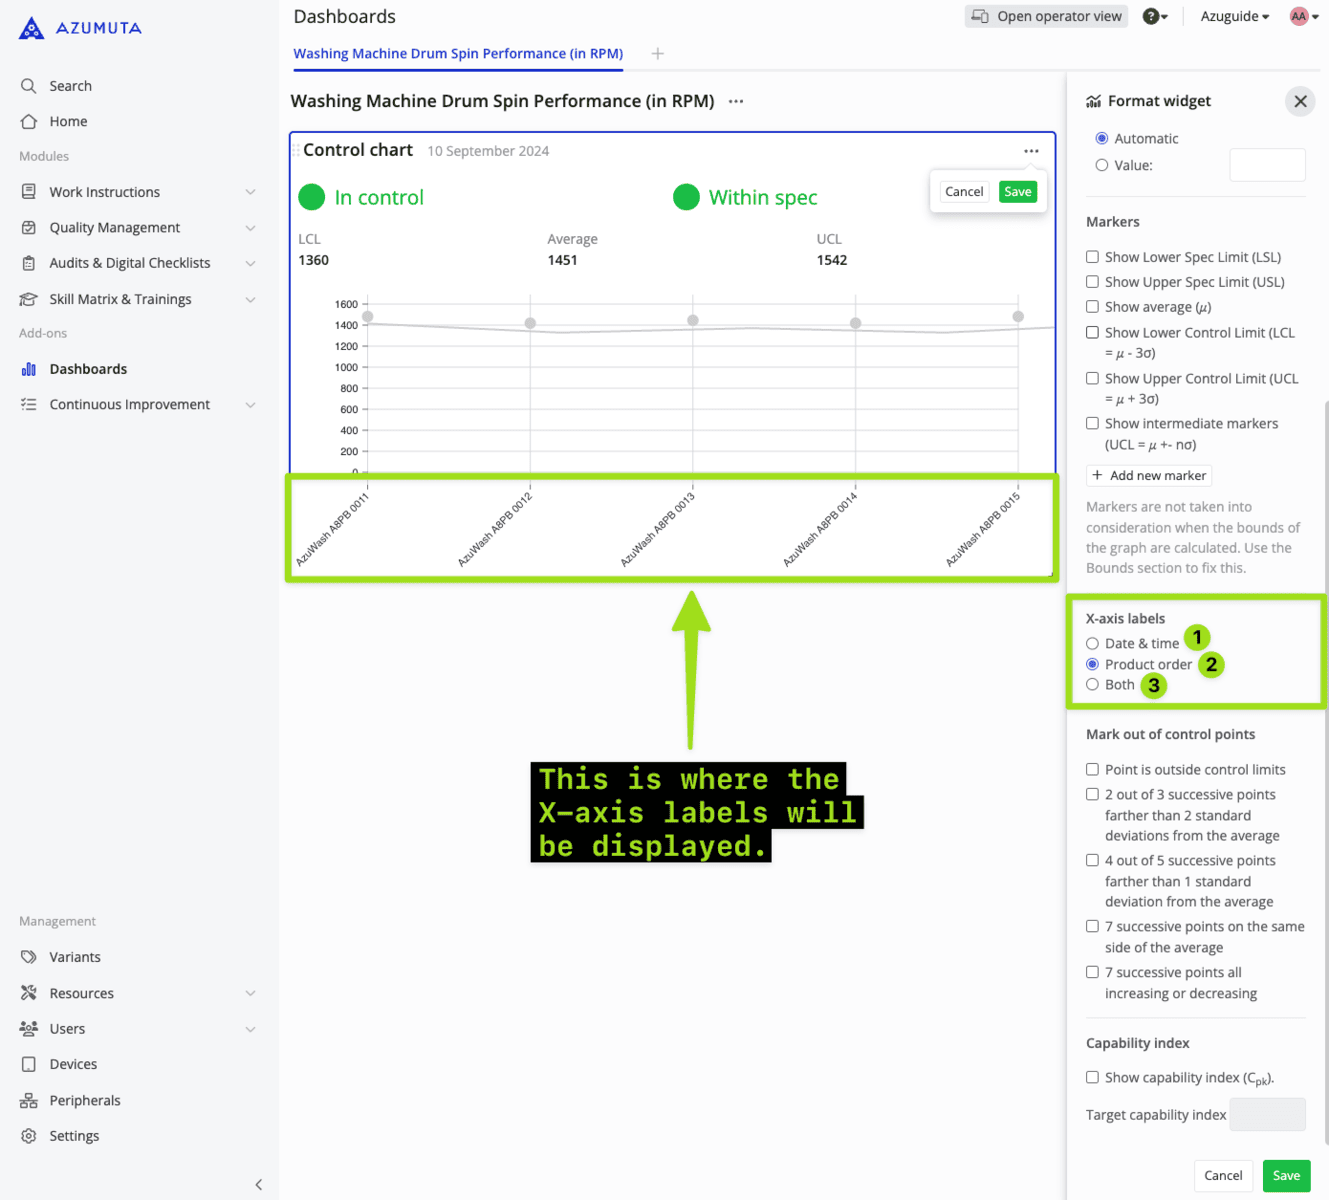
You can choose between displaying:
- The date & time of the product check’s execution.
- The name of the product order where that product check is contained.
- All of the above.
Mark Out of Control Points
These settings contain the variables that will be used to decide whether your last (rightmost) product check answer is considered as “In Control” or not. Therefore under these settings, you can choose which variables apply and which ones don’t by ticking the box next to each variable. Please have a look at the image below for further information: 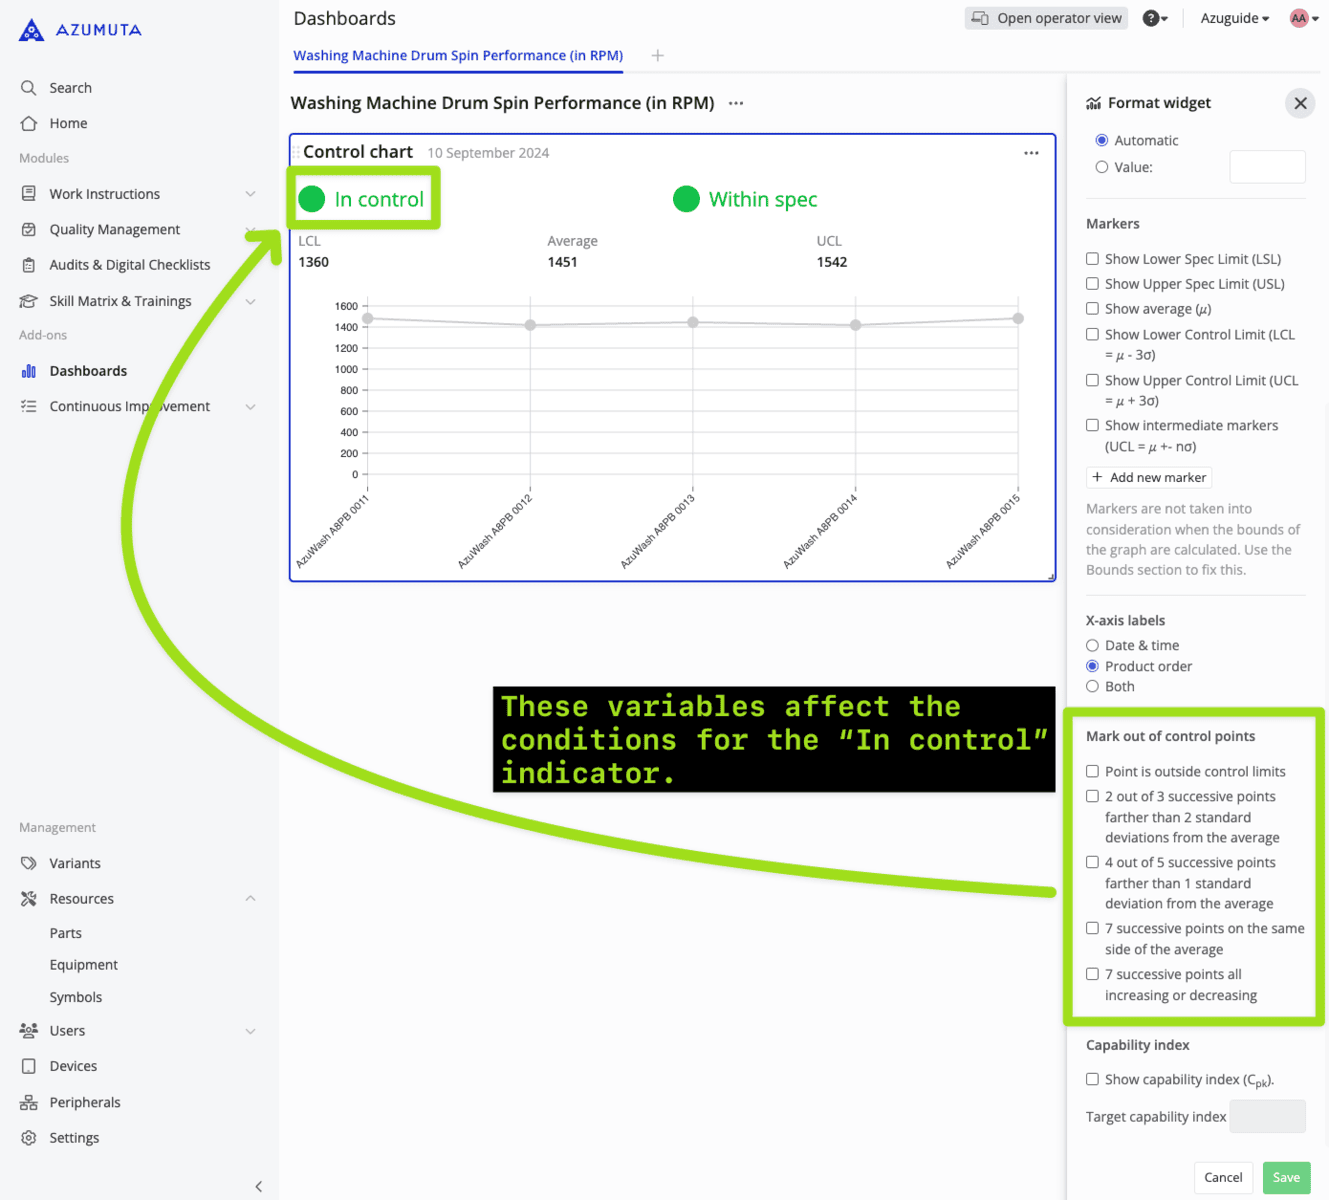
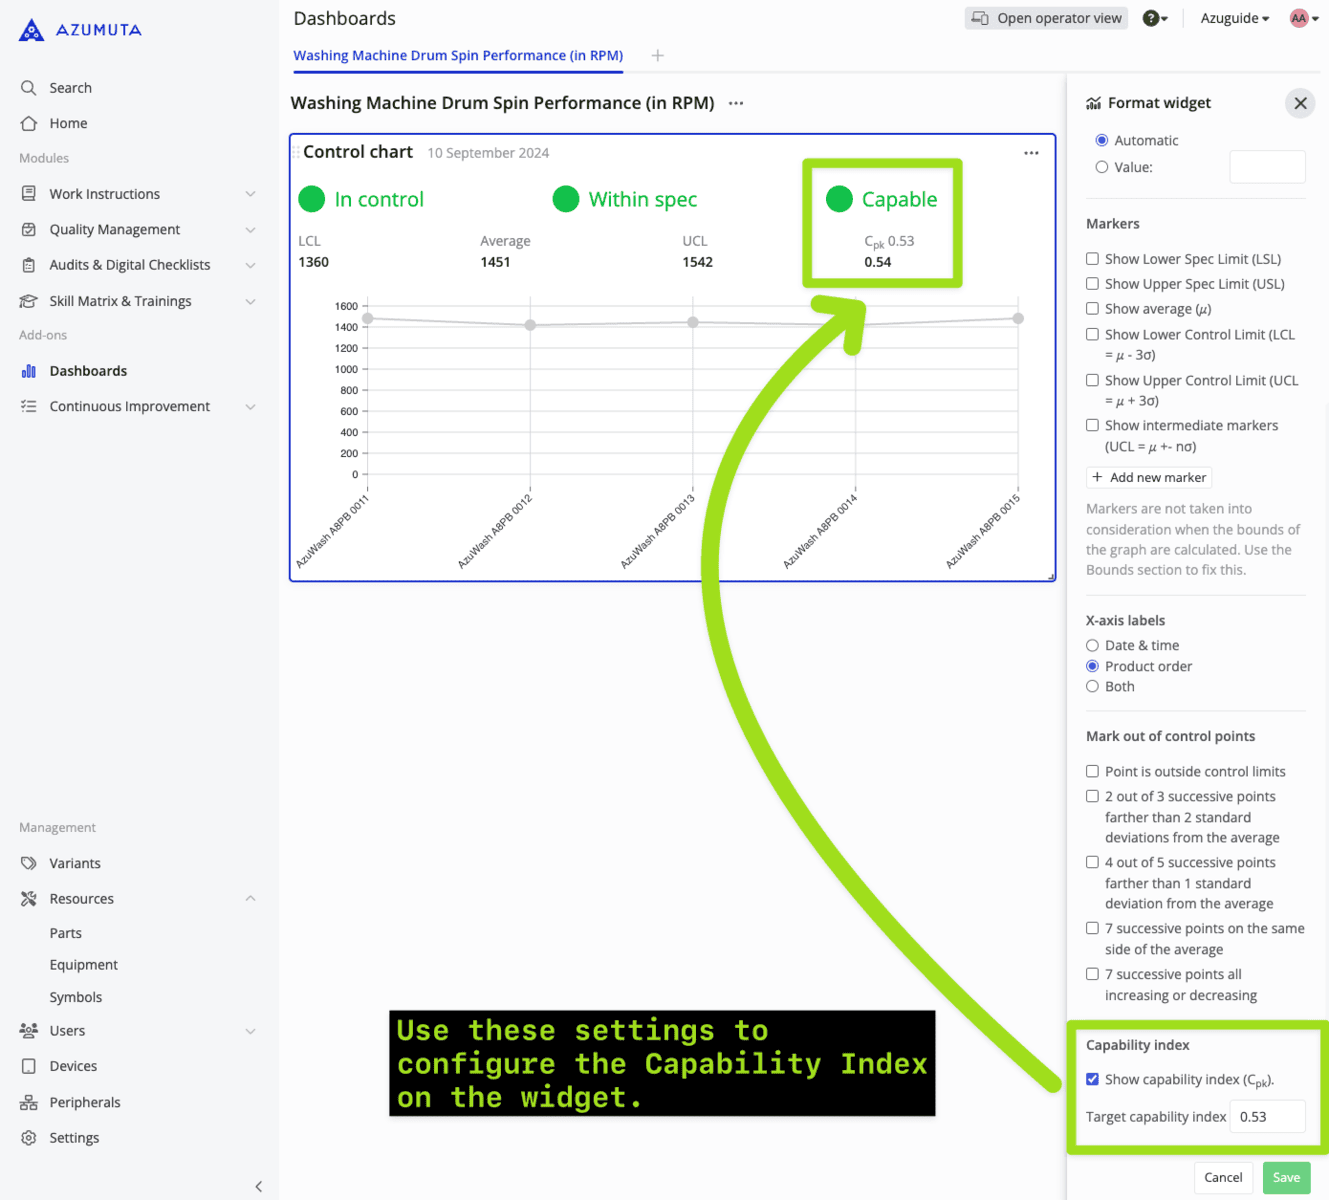
Capability Index
Select whether to display the Capability Index on the widget. You can input any value for the Capability Index target.
The Capability Index is a commonly used term in industrial engineering that refers to the ability of an engineering process to produce an output within its specification limits.